
OPEC
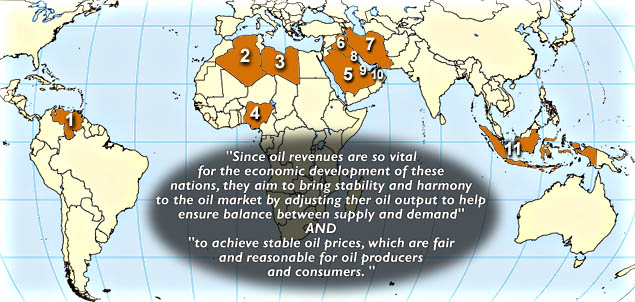
The Organization of Petroleum Exporting Countries (OPEC), has a simple charge, seen in the map below. For the geographically curious, mouse over any of the OPEC members to see an expanded view of the country. As you look through these, take special notice of the positions of borders and access to major bodies of water, as these often account for much of energy-related political intensity in these regions.
 Source: JPM & EJS
This oligopoly (a monopoly only has a single controlling entity, an oligopoly has cohorts acting together to form a controlling entity) controls production via quotas for each member country. The lower the production, the higher the price per barrel (providing there is enough demand). The higher the production, the lower the prices per barrel, but more barrels are sold.
OPEC is important for 2 very important reasons:
- OPEC countries produce 40% of the crude oil.
- OPEC countries have 75% of the World Reserve of crude oil.
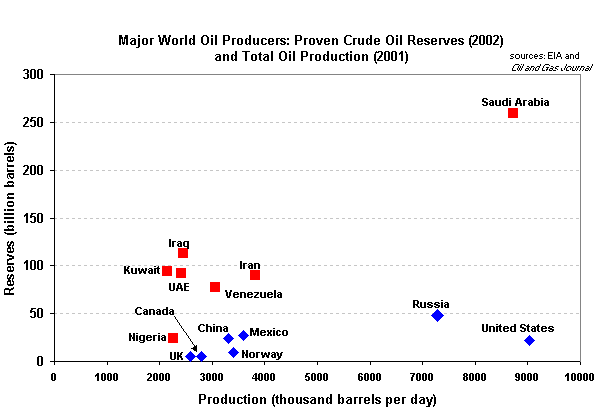 We have discussed lifetime of a resource before. Here the situation is shown graphically. Those countries with low reserves are close to the bottom of the ordinate (y-axis). The OPEC countries are shown as red Boxes. How long will Saudi Arabia's oil last at current production levels and oil reserve levels?
9,000,000 barrels a day x 365 days a year = 3.3 x 10⁹ barrels per year
Lifetime = 255,000,000,000 barrels / 3.3 x 10 9 barrels per year
Lifetime = 77 years
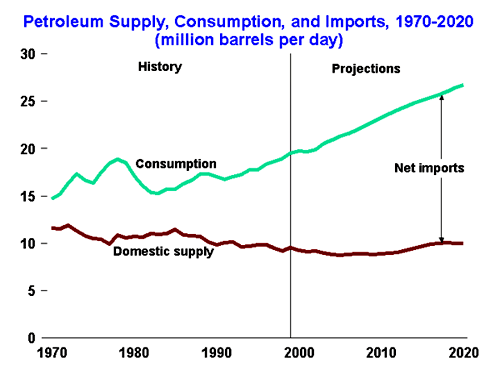
Recall that the US production is unlikely to keep up with current levels or with the growing economy (long term) so we are likely to rely more (higher %) on imported crude oil.
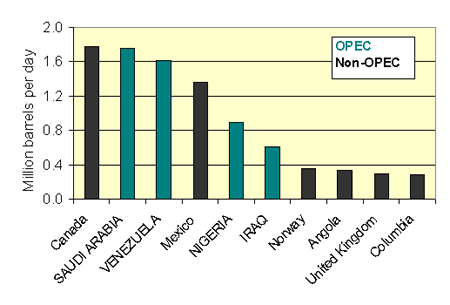 Source: EIAFour OPEC members are very significant sources of imported crude oil for the US.
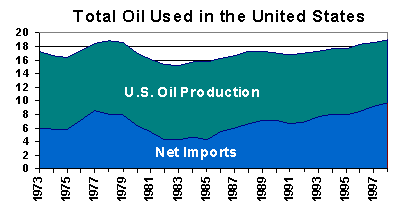 Source: EPAUS production increases and decreases depending on the economy. Note how much oil we use is increasing (economy and population driven, also temperature and driving habits related). But the imports are increasing at a faster rate (steeper line) than US oil production.
It would serve us well if we had good relationships with these important oil exporting countries. Unfortunately, some countries are "hostile" to the United States, on the "axis of evil list", and in regions of instability. There are also some well known "bottle necks" in the international trade of crude oil. So the threat of supply disruptions is high.
Oil Prices
If we look at the price per barrel over a long time period (normalized to adjust for inflation) it is very evident that price instability influences the industry. This has major impacts because oil is still the dominant energy source for the world, including the US.
Click on events for details (a new window will open). Pay special attention to The Arab Oil Embargo, the Iranian Revolution, Petroleum Price Decontrol, and the Persian Gulf Crisis. What's most important to grasp here is the basic relationships between certain events and oil prices.
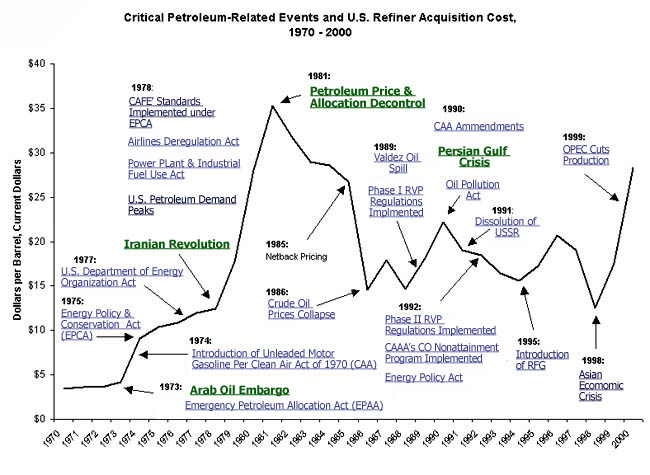 Source: EIAThis graph above gives you a visual sense of crude oil prices relative to important political events and legislative actions over the past 30 years.
Move the mouse over these events for more information. After 2000 the price increased, dipped and spiked at above $100 per barrel! This link shows missing data.
Flow of Energy
Now take a look at what the flow of U.S energy sources looks like. This chart is represented in quadrillions of BTU's, which about covers a year's worth of energy for this country. Notice the breakdown of where our energy comes from, how it is used and consumed, and particularly how dominant oil is in the mix. Green arrows lead to extra info on mouseovers.
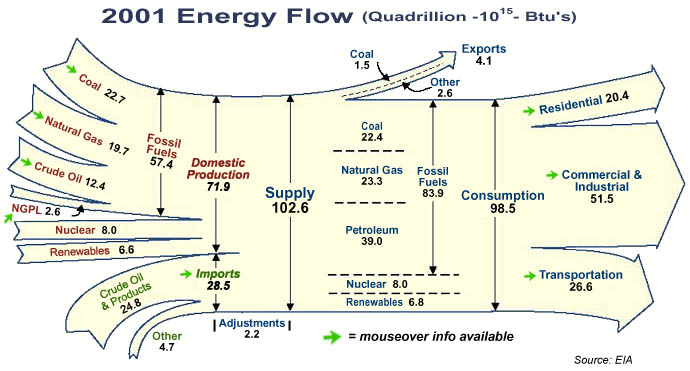
Source: EIA
Even with stabilizing domestic production of crude oil, we will rely more heavily on imports because we are going to be using more gasoline. |
Source: EIA
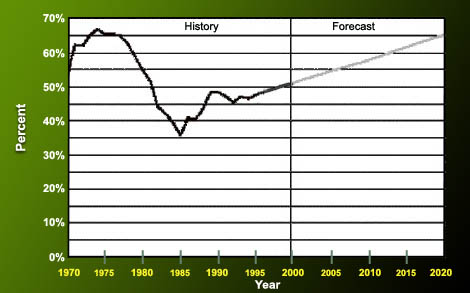
As the Persian Gulf was blessed with large reserves of crude oil that are cheap and easy to extract, we expect that for worldwide crude exports, that the region will again increasingly dominate the supply. |
The 1973 Arab Oil Embargo
To understand the events leading to the Arab Oil Embargo of 1973 you need to understand why Israel is in its unique situation. Go to the CIA World Factbook and select "Israel" look at the "background." Just as we Brit's managed to screw up completely every country we ever "owned," Israel is no exception. It is a United Nations created country. In 1973 Egypt and Syria jointly attacked Israel on Yom Kippur (the holiest day in the calendar). It was the age of the "Cold War". Syria was receiving military supplies from Russia and Israel military supplies from the US, UK, and the Netherlands. When Israel had survived the initial attack, recovered their lost ground, and looked to be capable of capturing large chunks of Egypt, the Arab nations (note this is not the OPEC nations) embargoed refused to sell crude oil to the US, UK and the Netherlands. They later expanded the embargo to the rest of Europe. The "Arab nations" are many of the key OPEC members. The resulting loss of crude oil and considerable uncertainty in the markets resulted in something America was not used to: rationing of gasoline and very significant gasoline price increases. As a result conservation, efficiencies, nuclear power, the strategic petroleum reserve, membership in the IEA, increase domestic crude production and fuel diversity became important to America's security. Does this sound familiar? Consider these options when you listen to the current administrations Energy Plan!
The Strategic Petroleum Reserve
The events of the 1973 Arab Oil Embargo resulted in the US joining the International Energy Agency (http://www.iea.org) and the formulation of the Energy Policy and Conservation Act of 1975. There were 2 important outcomes from these events (the act and joining IEA):
- The Strategic Petroleum Reserve was authorized in the Energy Policy and Conservation Act of 1975; it was also a requirement for membership (90-day supply of crude oil) in the IEA. This 90-day storage of crude and the promise to share crude oil between member countries was to dilute the influence of an embargo on individual countries. In the US we "drilled" massive skyscraper sized holes in deep salt deposits to store crude oil from around the world. Look at the SPR website to find out when these stored reserves can be released:
- The CAFÉ Corporate Average Fuel Economy standard was also introduced setting goals of 18 mpg with the 1978 model year increasing to 27.5 in 1985. Do you remember seeing this graph?
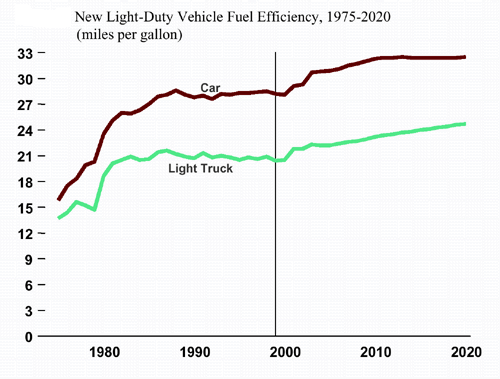 Source: EIAThe introduction of the CAFÉ standard was responsible for the increase in the mpg of new model automobiles until about 1988. We have not made much progress since then although predictions are that the efficiency will increase.
Nuclear Power
Prior to the Arab Oil Embargo we had no significant electricity generated by nuclear power. We also used fuel oil to power industry and electric utilities to a greater extent. In 1974 the US utility companies ordered 25 or so nuclear power plants. The US has more nuclear power plants than any other nation (110 or so). Other nations such as France and Japan rely on nuclear to provide a higher percentage of their electricity. The use of nuclear is one approach to help secure energy supplies. But in the days of smart bombs missiles and terrorist acts one wonders if our nuclear reactors, or oil refineries are safe from attack?