The relationship between global CO2 and global temperatures
Okay so we know the concentration of greenhouse gases has increased in the atmosphere over the last 50 years (Keeling curve and other observations) so what has happened with the global temperature over that time period?
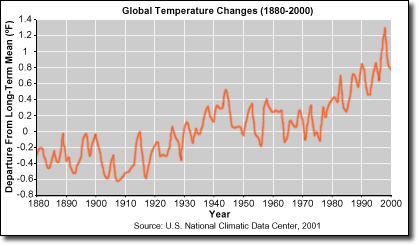 Source: EPAThe global temperature has both risen and fallen but the overall trend is of the global temperature getting hotter by about 2 °F or 1 °C (or Kelvin).
Okay so now we realize it is a complex issue. Other causes have been suggested such as increased solar activity warming the planet, which warms the oceans and reduces the amount of CO2 that can be held in the water. (huh????)
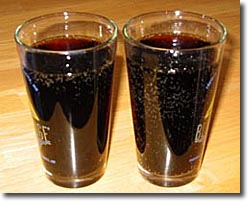 Can you tell which cola is cold and which is warm?Click here to see the movie. (6.8 MB) (Text Version)
The important fact is that the temperature of the planet has increased by about 1 °F during the last 100 years. Phew, I thought we were in trouble for a minute! Why all the fuss over about 1 °F?
If we look at longer timelines we can determine that this rate of change is very rapid! The planet goes through these changes anyway, but very slowly, usually. After all, the geography of large areas of North America is a result of ice ages and glaciers scouring the earth. So how do we know what the temperature was hundreds to thousands of years ago, or what the CO2 levels were?
How do we know what the temperature and C02 concentrations were?
I. Look at tree rings.
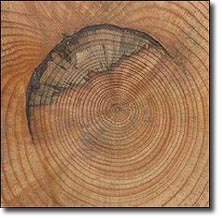
Some of the trees in the world live long, long lives and by looking at the thickness of the rings as well as the number the relative climate can be determined. This technique was used to show that the first few years of the Jamestown colony where very dry which contributed to their near starvation (thank goodness for Thanksgiving!) While this technique can only go back a few hundred years it is still very useful for looking back at climate history over those years. The image shown indicates a little trouble with a forest fire in its history. Here at Penn State there is a tree ring laboratory, where this image was obtained (with permission I might add!). Recall that trees grow because of CO2 (the carbon cycle) they grow faster with more CO2 so some beleive that we should treat CO2 not as a pollutant but rather as a fertilizer for the trees. More CO2 may well produce quicker growing forests and other crops!
This tree looks to be about the same age as I am!Click on the speaker icon to listen to an audio track about wood from the lake.
(Text Version)
II. From Ice Cores
The air temperature influences the sizes of snowflakes. Warmer snow has larger flakes. Thus, when you look at snow after digging a hole to sit in you will see layering. This is useful information for the prediction of avalanche conditions. As the snow ages and more snow is deposited on top the snow will form ice. There are a few locations in the world where the ice is very thick and hence there is data for thousands of years in the ice cores that they drill and bring back to interpret. You can also see the volcanic dust from long since past eruptions and date the ice with known volcanic events, or simply count the ice layers as you would rings on the tree (size of the snow flake influences the optics of the ice, which is related to the temperature).
Another very useful aspect of the ice is small air bubbles trapped within. These are miniature time capsules that contain a sample of the air from when the snow fell. Thus, we can determine the levels of CO2, methane or other gases in the atmosphere. We have some faculty here at Penn State that do this. Dr. Richard Alley!
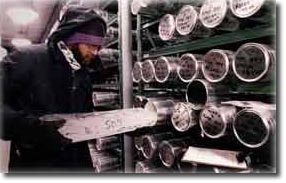 Source: USGCIce cores, containers for miniature time capsules of earth's atmosphere.
III. From Coral
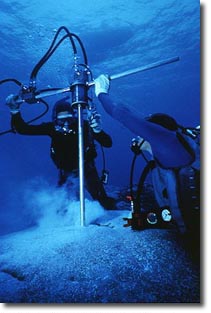
In the same way that ice cores can reveal both temperature and a measure of the gas concentrations coral can also indicate the temperature and the concentration of CO2 in the ocean that is, by the carbon cycle, related to the concentration of CO2 in the atmosphere. Coring the coral looks like a much better job than coring the ice! As the coral has a slow growth rate there are again thousands of years of information available in certain locations. Unfortunately for the coral, the temperature sensitivity will cause their loss in some locations, if it gets much warmer.
Source: NOAAA pair of divers drilling coral core samples.Here is some data from a longer time period!

