We've introduced the topics of rain, topography, river flow and seasonal flooding. How are they related to one another? What does it have to do with the Nile?
Let's look at some data collected in Pennsylvania rivers. Examine the top two streamflow discharge graphs. Streamflow is measured in units of cubic feet per second - in other words, how many cubic feet of water pass through a stationary measuring point each second. (You'll learn more specifics about streamflow and flooding events and how they are measured in the upcoming virtual river exercises.)
Across the very top of each graph are the letters USGS (United States Geological Survey, the federal organization that oversees water monitoring and investigations in the United States), a USGS identifier number, and the name of the river with the city and state where the data were collected. The upper graph is for a stream located just to the west of Philadelphia in the city of Media, while the Susquehanna River measurement was taken where the stream flows through Harrisburg. On the X-axis, you can see the date. Measurements were collected during a one-week period in the summer of 2005. On the Y-axis, you see the streamflow dischrage represented.
What do you notice about these graphs first? Well, you can't help but notice the blue line going across. This blue line represents realtime water data, collected at 15-60 minute intervals. Notice that the Ridley Creek graph shows a significant peak on July 8, while the Susquehanna River graph shows a small increase. What might have caused the increase in streamflow to be so different between these two locations?
Well, if you remember back to summer 2005, it was quite a crazy year for hurricanes. On July 8, the remnants of Hurricane Cindy passed through the Philadelphia region, pouring down a large volume of rain. Where does all of that rain go? Some of it gets absorbed into the ground and enters soil layers and the groundwater systems, but much of it will "run off" into local streams, such as Ridley Creek. Those rainfalls didn't reach Harrisburg, so the streamflow record there was not impacted as significantly - or was it? Notice that the scale on the Y-axes of the two graphs below are different! Overall, the streamflow in Ridley Creek is much less than the streamflow in the Susquehanna River, so be sure to pay careful attention to the scale of the axes when you make interpretations!
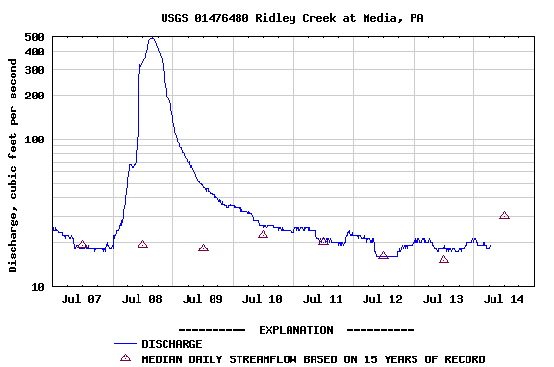
Ridley Creek hydrograph for 2005. Source: U.S. Geological Survey.
Note: Please click on the image to see a larger version.
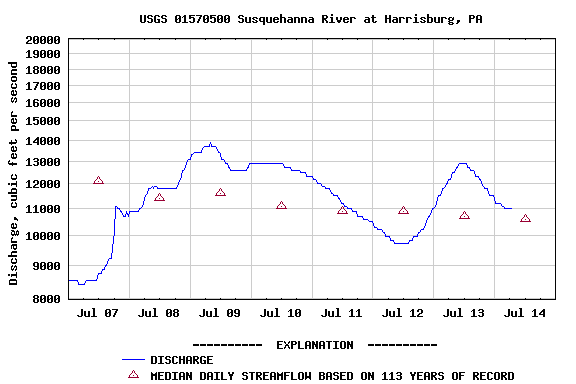
Susquehanna River hydrograph for 2005. Source: U.S. Geological Survey.
Note: Please click on the image to see a larger version.
But what else do you see on these graphs? Yes, there are red triangles. Those triangles represent the median streamflow discharge for that date. As you can see, the Ridley Creek station has been collecting data for the past 15 years, while the Susquehanna River station has been in place for 113 years. How do these data compare with the 2005 record?
The graph below shows a much longer record for Ridley Creek, with the blue line representing the daily mean streamflow discharge from July 2005 to January 2006. Instead of red triangles, we have a red line showing the median daily streamflow for the past 15 years. Can you think of reasons why there are more significant variations in the 2005-2006 record than in the record from the past 15 years? What causes the variations, or "wiggles," in the first place? You have the example of Hurricane Cindy, but that doesn't explain what may impact streamflow in the winter months. How do you think the 2005-2006 streamflow record will affect the median streamflow record?
Ridley Creek hydrograph from July 2005 to January 2006. Source: U.S. Geological Survey.
Note: Please click on the image to see a larger version.
The following graph shows the approximate flow in each of the Nile tributaries on a monthly basis for a typical year. Notice that the three rivers have different flow patterns: The Blue and Atbara have dramatic floods over a short period of time, while the White has a more muted seasonality. In addition, the streamflow during the summer months (the "rainy seasson") is significantly higher in the Blue Nile versus the White Nile. Why do you think that is? Perhaps it has something to do with the elevation change along the length of the river? Perhaps a steeper gradient, or slope, leads to faster streamflow? The answer to all of these questions is yes!
Annual Flow in the Main Nile Tributaries. Source: Dr. Tanya Furman.